


As precious metals surge on safe-haven demand, some gold mining companies are following suit. One standout is AngloGold Ashanti Ltd. (AU), which has been riding this upward momentum.
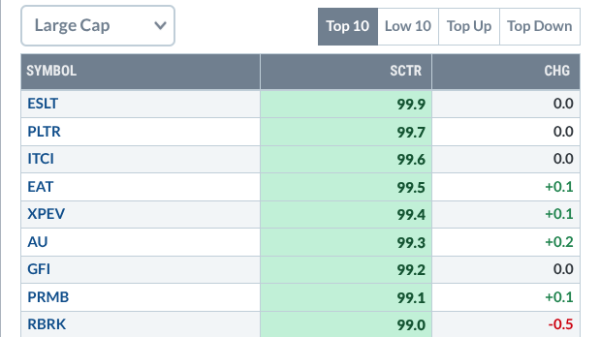
Recently, AU showed up among the Top 10 Large Cap category in the StockCharts Technical Rank (SCTR) Reports, indicating that it’s among the top large-cap stocks showing bullish technical strength across multiple timeframes and indicators.

FIGURE 1. SCREENSHOT OF SCTR REPORTS ON MONDAY MORNING. AU, which held the #6 spot at the time of the screenshot, had an ultra-bullish SCTR score of 99.3.
Unless you follow gold miners, you may not know much about AU. But here’s the skinny: AngloGold Ashanti Ltd. is a global independent mining company that’s incorporated in the UK but headquartered in Colorado, US.
AU’s recent surge can be attributed to several factors, including rising gold prices, strong financials, recent strategic acquisitions, revised dividend policy, and general investor shift to safe havens.
If you’re unfamiliar with the stock, a good starting point is to compare its relative performance against its industry (Dow Jones Gold Mining Index or $DJUSPM) and spot gold price performance ($GOLD). The PerfChart below displays AU’s performance relative to the industry and gold’s price over the past year.

FIGURE 2. PERFCHARTS OF AU, DJ GOLD MINING INDEX, AND GOLD. AU began outperforming its overall industry and gold’s performance in late January.
AU and $DJUSPM have shown volatile, back-and-forth price action over the past 12 months, but AU began taking the lead in late January, surpassing both in comparative terms.
Now that you have a comparative view, let’s take a longer-term look at AU’s price action. Here’s a monthly chart spanning 20 years. Why so long? I had to go this far back to plot long-term resistance levels.

FIGURE 3. MONTHLY CHART OF AU. The stock just broke above a resistance range between $35 and $37, but there are plenty more technical headwinds above.
AU appears to be soaring at relatively high valuations and is running up against a major resistance range between $42 and $45. What adds weight to the long-term bullish case of AU’s current valuations is the rising Ichimoku Cloud, indicating a long-term uptrend projection (26 months) and a Relative Strength Index (RSI) reading that is rising but not quite overbought. Another thing to note, which is interesting, is that every time the RSI crossed 70, AU reversed to the downside.
Despite this bullish projection, keep in mind that AU could still pull back—while remaining in a long-term uptrend—and decline to as low as $22.50 before rebounding. This level marks a key swing low and aligns with the top of the Ichimoku Cloud’s support range.
That gives us a long-term perspective. What about the near term? Might there be a favorable entry point for those looking to go long, or is AU technically overbought?
Let’s shift over to a daily chart.

FIGURE 4. DAILY CHART OF AU. Pay attention to the most recent swing high and low.
The Gold Miners Bullish Percent Index (BPI) indicates strong bullish breadth as over 89% of gold mining stocks are rallying and triggering P&F buy signals. However, this can also indicate potential overbought levels, and the RSI supports this reading, as it, too, is over the 70 threshold (caveat: a stock can continue to rally for an extended period despite being overbought).
Volume-wise, note how accumulation preceded AU’s rally as far back as September when the Accumulation/Distribution Line (ADL) shown in orange began rising above AU’s price as if the smart money began accumulating the stock as it continued to decline before rebounding. AU currently trades above the ADL line, which could signal a near-term pullback.
Pay attention to AU’s price relative to its most recent swing high (magenta dotted line) and swing low (blue dotted line). I plotted a ZigZag line to make these swing points clear.
- If AU pulls back, it may find support at the swing high near $33. What’s more important is that the stock price must hold above the swing low near $28 to sustain the current uptrend.
- Expect resistance between $42 and $45 (as mentioned earlier when analyzing the monthly chart).
What Should You Do?
If you’re already in AU and not necessarily committed to the long term, consider tightening your stops or scaling out partial profits as the stock approaches the $42–$45 resistance zone. The RSI above 70 and elevated breadth readings across the gold mining sector suggest short-term overbought conditions, making a pullback likely—even within a broader uptrend. Watch for any bearish divergences or volume reversals, and use a bounce from $28 or $33 to potentially add to your position.

If you’re looking to enter, patience may pay. A retracement to the $33 support zone—or the swing low at $28 if sentiment reverses sharply—could offer a more favorable risk-reward entry. Keep in mind that a break below $28 would weaken the current technical structure and could open the door to a deeper correction, potentially down to $22.50.
For long-term investors, AU still holds promise. The rising monthly Ichimoku Cloud you saw in the monthly chart, strong accumulation trends, and outperformance vs. peers support a bullish longer-term case. But stay disciplined, and keep an ear on economic developments that may have a longer-term impact. Consider using a tiered entry approach rather than chasing highs.
In short, AU’s long-term momentum is intact, but don’t ignore the warning signs of a short-term cooldown. Stay tactical—ride the trend, but always protect your capital!
At the Close
While AU continues to ride the wave of bullish sentiment in the gold sector, a few of its technical indicators, appearing seemingly stretched, hint at a possible short-term breather. Long-term prospects remain intact, but near-term caution is warranted.
Disclaimer: This blog is for educational purposes only and should not be construed as financial advice. The ideas and strategies should never be used without first assessing your own personal and financial situation, or without consulting a financial professional.